
Let’s Compare: GP to BC Troubleshooting Tools, Techniques, and Tips
Troubleshooting can sometimes be an art, sometimes it’s a science. For the generation of Dynamics GP superusers and system administrators who know how to maintain their ERP system, this post will compare eleven common troubleshooting tools and techniques and provide insights and tips about ‘how to do’ different types of troubleshooting in Business Central.
IF YOU JUST WANT TO SEE SOME OF MY FAVORITE BUSINESS CENTRAL TROUBLESHOOTING TOOLS AND TECHNIQUES —> SCROLL DOWN ABOUT 1/3 OF THE WAY, PAST GP!
I intend to add more BC Troubleshooting Tools to this reference post as I put more of them to use, but the good news is that the collection I’ve found worthwhile so far wasn’t worth withholding anymore, so I hereby give it to the Universe, with the promise to come back for some periodic updates as troubleshooting in general spans a wide gamut of potential conversations. It is always good to be aware of and embrace new methods of rooting out problems and optimizing performance. Don’t you agree and want that for your environment too?

Tried and True GP: Troubleshooting Tools and Techniques
While Dynamics GP may not be the newest ERP on the block, it remains a powerful and widely used system. But when things go wrong, knowing where to look can save hours of frustration. In this section, we’ll explore 10 essential tools and techniques for troubleshooting in GP, each with some real-world examples to help you understand more about how the tool is used.
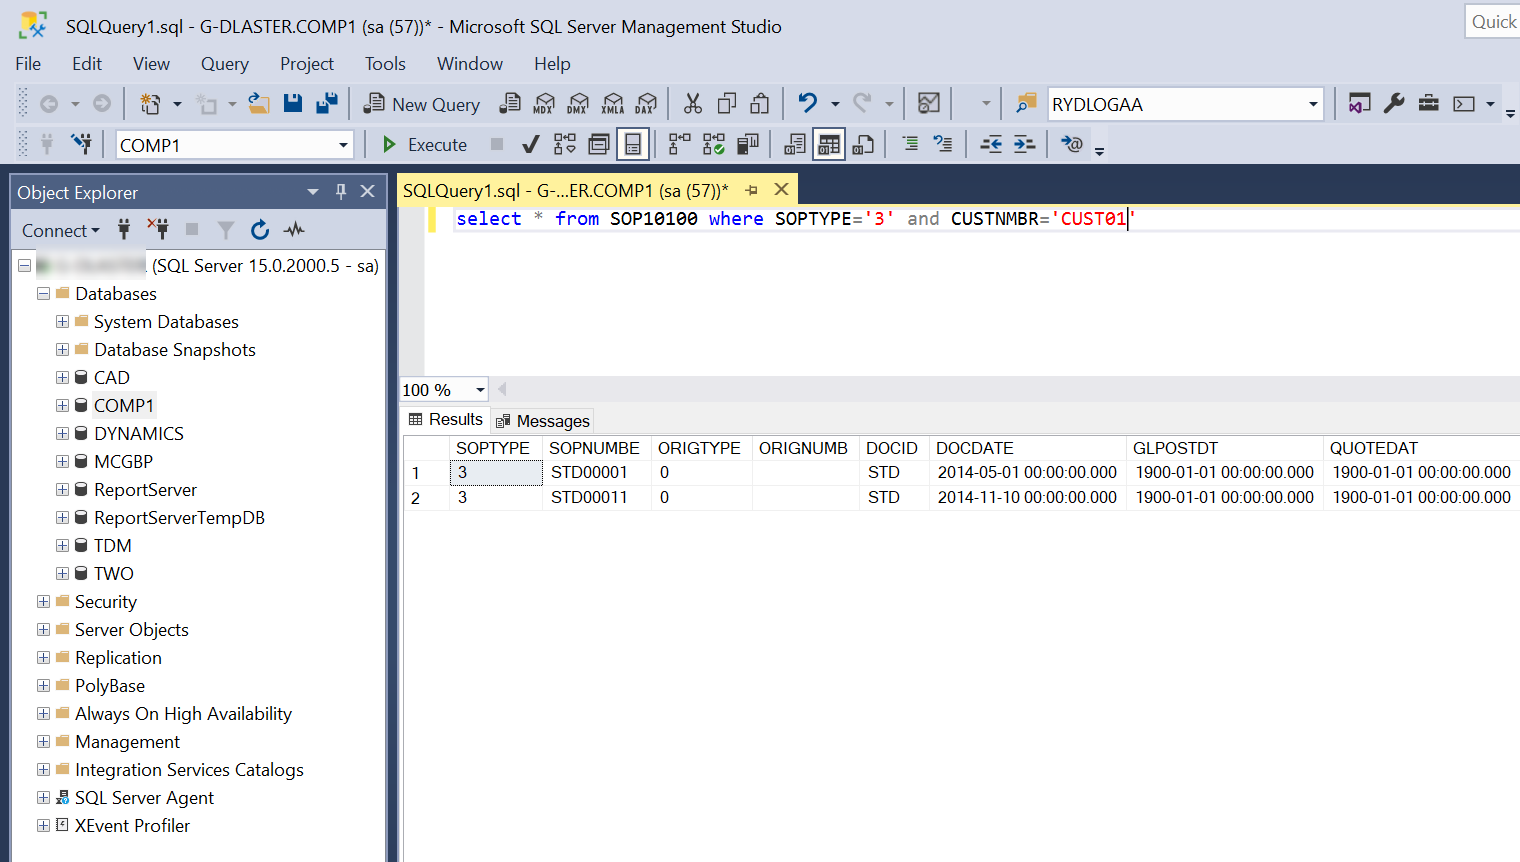
1. SQL Server Management Studio (SSMS)
What it does: Provides direct access to the GP database for querying, diagnostics, and data correction.
How to use it:
Use it to manage the entire on-prem SQL Server database environment
Connect to the GP company database.
Use SELECT queries to investigate data issues.
Use joins to trace transactions across related tables.
Use INSERT, DELETE or UPDATE queries to correct inconsistencies in data directly in the database tables.
Create Maintenance Plans to automate backup jobs.
Adjust properties on individual databases within the SQL instance.
Examples:
A posted invoice doesn’t appear in the Receivables Aging report. A SQL query shows it has an incorrect Amount Remaining vs the sum of the Apply records and needs to be corrected.
A batch is stuck in a “Posting” status. A query reveals a missing record in the SY00500 table.
A user reports incorrect inventory quantities. A query shows a negative quantity in IV10200 due to a backdated transaction.
Every GP Admin and consultant knows their way around SQL, to varying degrees, because it is the backbone of Dynamics GP. We’ve become intimate with the logical table numbering, the strange field naming, and what DEX_ROW_ID really means. We know the best reporting tool is a SQL View, and that SSMS is the tool we use to manage the entire database environment.
>> There is no real equivalent to SSMS in Business Central. We have some elements to controlling the database environment, but those are limited to the Admin Center, however this limitation is supplemented by the magic we can work with all of the on-board analytics, Extensions and Queries for BC. This took some learning, but trust me - we are generally OK with not having it. It is frustrating to get over, but before long you’ll see - trust me!
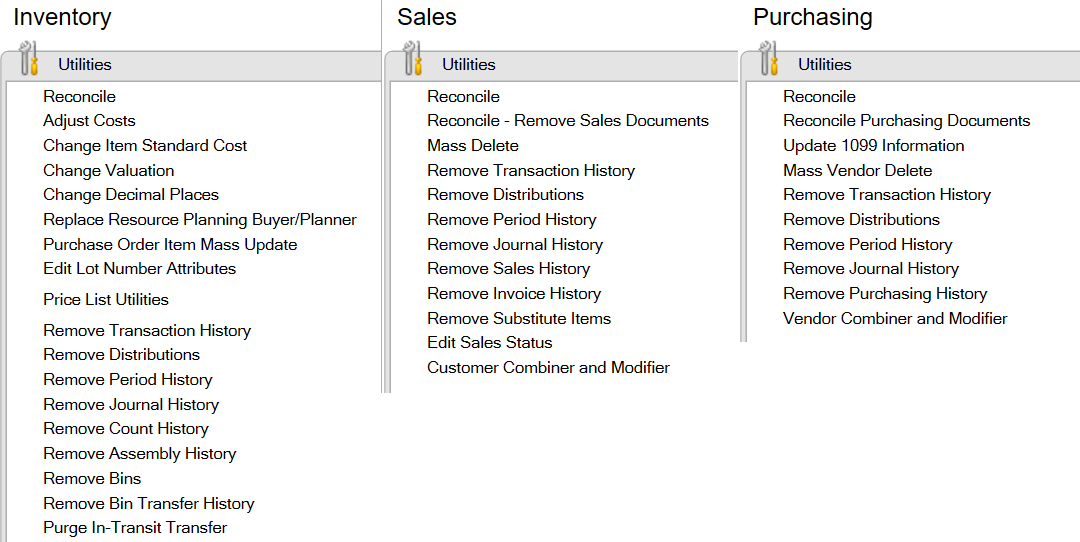
2. GP Utilities (the in-app Utilities panes, not DynUtils.exe)
What it does: Performs system maintenance tasks like table reinitialization, reconcile, and upgrade.
How to use it:
Launch module-specific GP Utilities from the GP Menu > Utilities or from many of the GP Navigation Area Pages
Launch Check Links and perform Payroll Updates from the GP Menu >> Maintenance
Use Change Decimal Places under Inventory to bump out an item’s decimal setup
Examples:
A user can’t post a batch due to a missing GL account. Reconcile corrects the account index.
Inventory quantities are off. Reconcile Inventory corrects on-hand balances.
The most common utility I think people run in GP are the Reconcile ones. They align the summary totals with the sum of the details. Each module has its own thing though, and we have learned to use them to adjust and adapt GP for various reasons.
>> BC Doesn’t really have a similar utility, as the data integrity feels tighter, and we have less of a need to force periodic reconciliations.
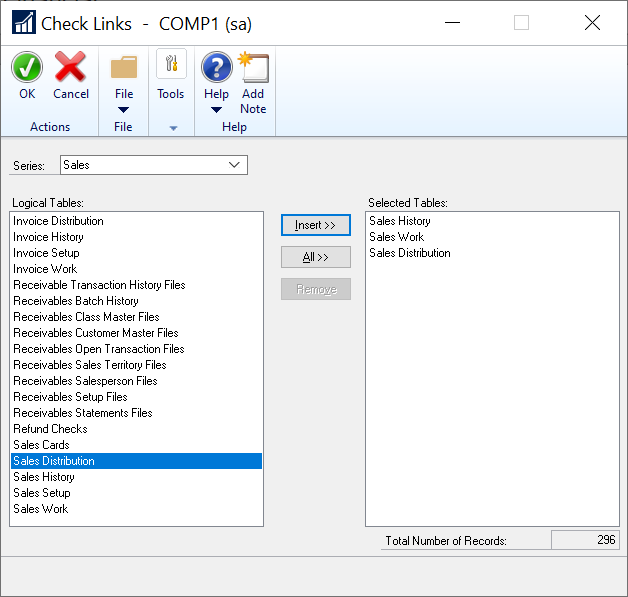
3. Check Links
What it does: Repairs data inconsistencies by rebuilding indexes and relationships.
How to use it:
Go to Microsoft Dynamics GP > Maintenance > Check Links.
Select the module and tables to check, print the report to file, and review any issues that get corrected.
Examples:
A customer record doesn’t appear in SmartList. Check Links on RM Customer Master fixes the issue.
A purchase order is missing from the inquiry window. Check Links on POP tables restores visibility.
A GL account shows up in reports but not in the chart. Check Links on Account Master resolves it.
We joke, but one of the first things often done with troubleshooting GP is to run Check Links to see if it kicks out or corrects any bad records in the database. It doesn’t always solve the issue, but it is a fairly reliable step when troubleshooting certain things in GP.
>> BC Doesn’t really have a similar utility, as the data integrity feels tighter, and we have less of a need to force periodic reconciliations.
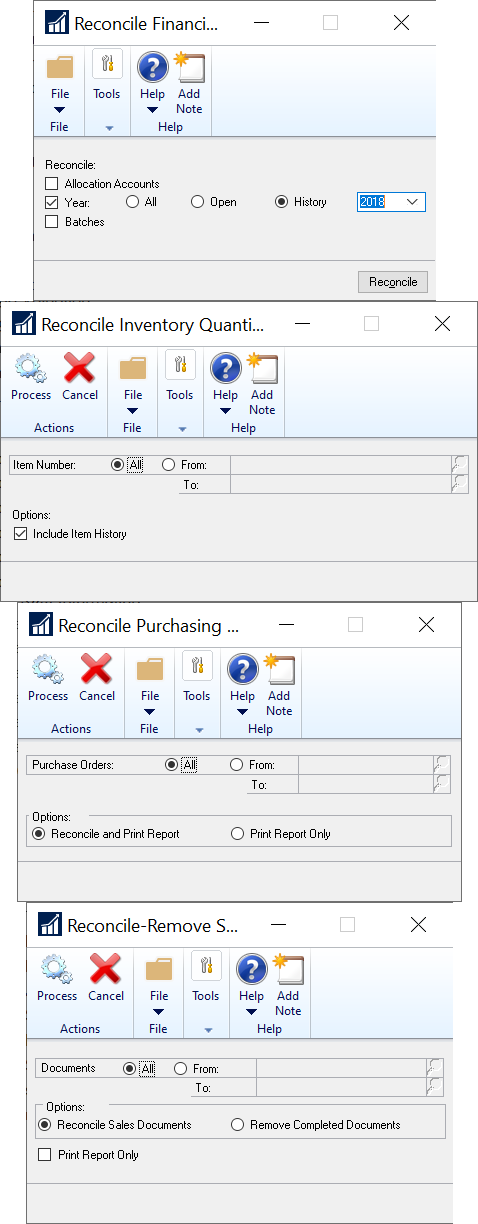
4. Reconcile Utility
What it does: Recalculates summary data to match transaction-level detail.
How to use it:
Go to Microsoft Dynamics GP > Utilities > Reconcile.
Choose the module and range (e.g., Receivables, Inventory).
Examples:
A customer’s balance is incorrect. Reconcile Receivables recalculates the correct balance.
Inventory valuation is off. Reconcile Inventory corrects quantity and cost mismatches.
A vendor’s 1099 total is wrong. Reconcile Payables updates the summary fields.
Reconcile is a Utility that can be run to re-summarize the totals in the system based on the transactions themselves. Sometimes this reconciliation gets off and the utility aligns the values. Each module has its own Reconcile, some have more than one option for reconciling different ledgers within the module.
>> BC Doesn’t really have a similar utility, as the data integrity feels tighter, and we have less of a need to force periodic reconciliations.
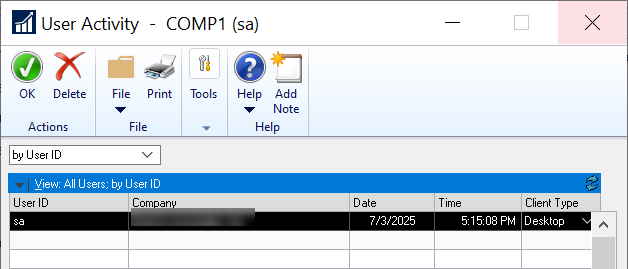
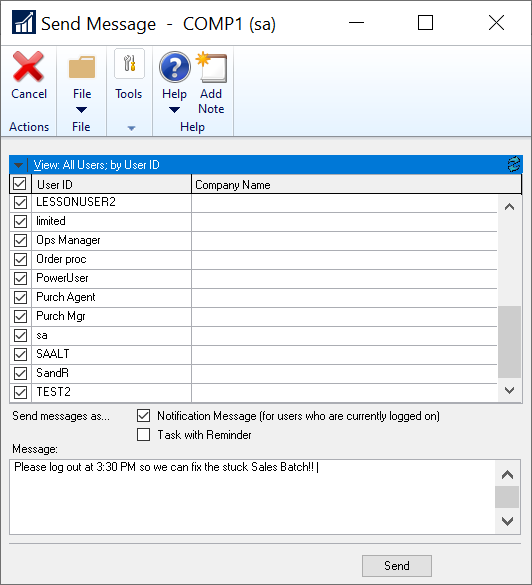
5. User Activity and Send Users Message
What it does: One window displays user sessions in the GP Activity table; the other tool informs users with an on-demand pop-up window and custom message
How to use it:
In GP go to Dynamics GP > Tools > Utilities > System > User Activity
Filter by database and look for stale sessions or stuck users
Ensure list is empty when no users are in GP to optimize concurrent license availability
Go to Dynamics GP > Tools > Utilities > System > Send Users Message to issue a notification.
Examples:
A user is away from their desk and needs to be removed so another can log in, use the Delete feature to remove them
A company is supposed to be taken offline, but there are still users with recent logins who may prevent successful updates
Notify the users about urgent maintenance that requires everyone to log out of GP at a particular time.
The User Activity table in GP tracks logins and logouts and informs of the availability of concurrent licenses to users logging in. Sometimes it has old/stale records that need purged, other times an active user is truly stuck, needs booted out, and then they can log back in.
>> BC Has its own approach to tracking changes, called Change Log. Read all about it and see examples below in the Business Central section. It also has a tool in the Admin Center to cancel sessions, also discussed below.
The Send Notification Message feature which notifies users who are currently logged in about something urgent in GP has been nice to use as a reminder to laggards who knew they should have logged out 10 min ago so I could perform that special update they requested!!
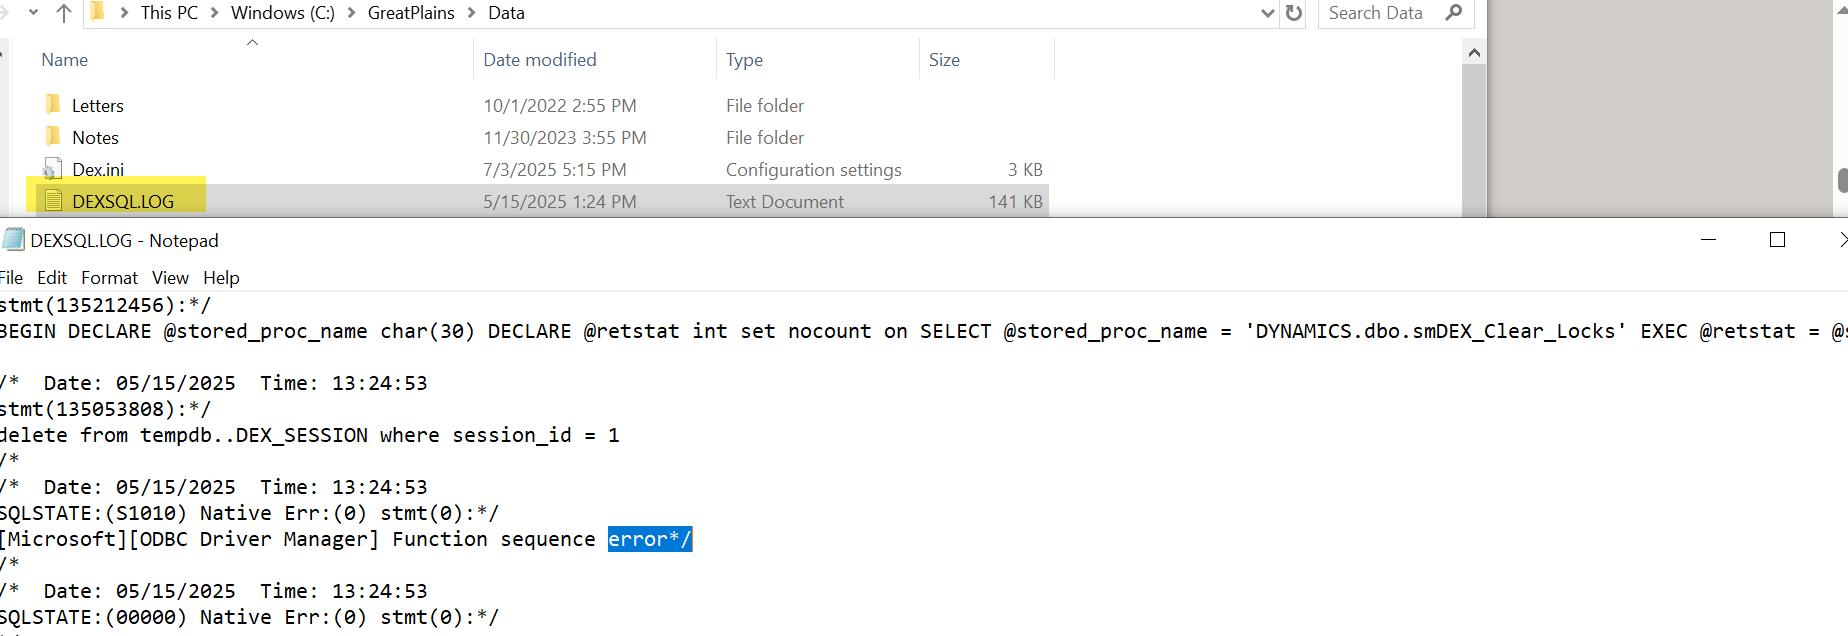
6. DEXSQL.LOG
What it does: Captures SQL statements generated by GP for debugging.
How to use it:
Enable DEXSQL.LOG in the Dex.ini file.
Reproduce the issue and review the log file.
Examples:
A posting error occurs. The log shows a failed insert into GL20000 due to a null value.
A report fails to load. The log reveals a missing join in a modified report.
A custom integration or ISV solution fails. The log shows the exact SQL statement causing the error.
I think every GP System Admin has created a DEXSQL.log file and tried to decode the meaningful information once they find it. Often it points to a piece of the puzzle you are trying to solve (e.g. a table, a missing proc, or a permission).
>> BC doesn’t have locally-installed files in the same way that GP did, so all of the logging we can initiate is from within BC somewhere.
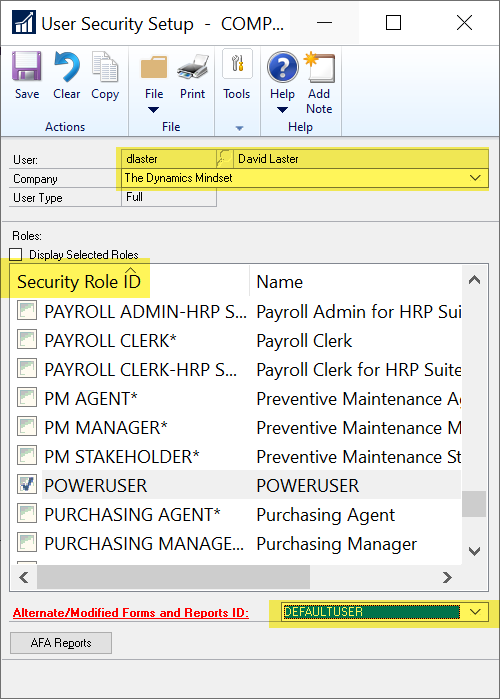
7. Security Task and Role Setup
What it does: Manages user access to windows, reports, and data.
How to use it:
Go to Microsoft Dynamics GP > Tools > Setup > System > Security Tasks/Roles.
Review and assign permissions.
Examples:
A user can’t access the Payables Transaction Entry window. Security Role is missing the task.
A report is unavailable. The user’s role doesn’t include the report library.
A user can post but not void transactions. The task lacks access to the void window.
One of my favorite reports ever that I every wrote was with Power BI for GP Security (don’t laugh too hard please!) It is called the GP Security Analyzer and is still available if you are interested or want a peek at how it dramatically simplified security reporting for GP. Managing and maintaining security in GP takes some understanding about the relationship between Users, Companies, Roles, Tasks, Operations, and Form Control, and the OOB reporting tools for GP are rather “lacking” in today’s world, yet important to confirm you have controlled segregation of duties and access to financial information properly.
>> BC uses Permission Sets to roll down permissions to users. Much like GP, some troubleshooting that frequently needs done is actually around user access or security configuration.
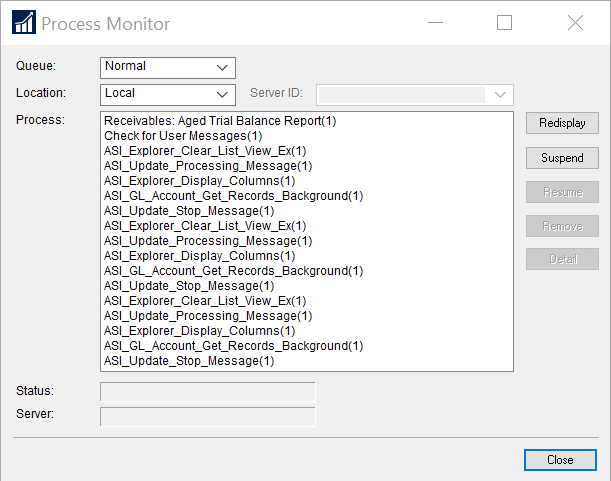
8. Process Monitor
What it does: Provides advanced user-specific, workstation-specific insights to expected and ongoing processes. Especially good at detecting a hung process that often is waiting on user-input, however could reveal a number of other issues blocking the ‘next step’ in the user experience.
How to use it:
Navigate to Dynamics GP > Process Monitor
The top of the list is the current task (often, but not always, this is a printing issue of some kind)
The rest of the processes NEED to finish to confirm data consistency in GP
Complete / Bring To Front the top task and /or wait for its completion
Ensure the rest of the tasks complete successfully before logging out of GP
Examples:
A user reports never getting a report they printed. Check the Process Monitor page to complete / resume the top entry
The user gets error message about not being able to log out of Dynamics GP until processes are completed.
This tool needs to be opened by the user from the workstation experiencing an issue. Typically we train the user to monitor the Process Monitor window when we are working through unusual posting issues. This window highlights the order of events expected to occur based on user input and SQL Server responses.
>> The closest we can really get to this type of thing in BC might be the Job Queue, but in reality, foreground tasks in Business Central would generally freeze the UI until the task (e.g. Copy Company) is completed.
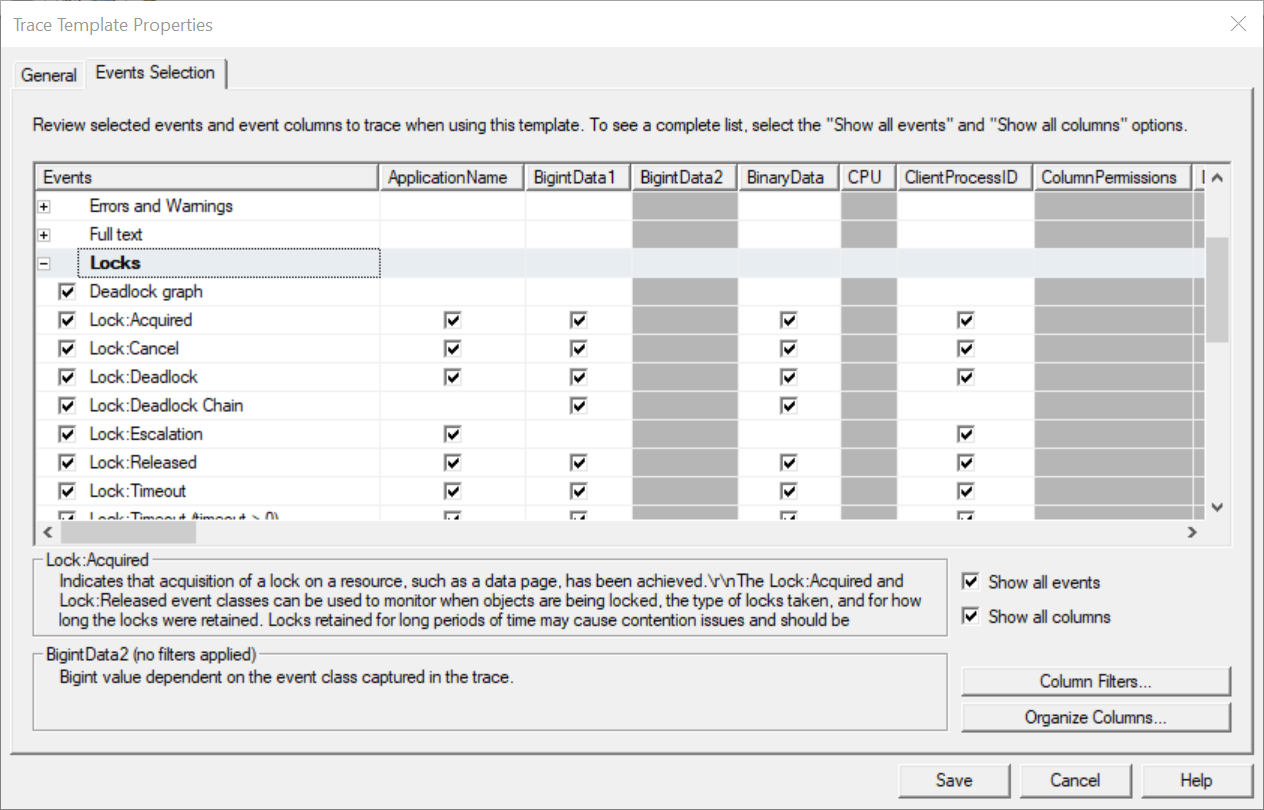
9. SQL Profiler / Trace
What it does: Provides advanced diagnostics, logging, and tracing.
How to use it:
Install SQL Profiler.
Use the recording feature with user and other filters to ‘capture’ issues real-time.
Use the profile recording to dive deeper into any intermittent issues.
Recommend following this KB for performing a GP SQL Trace:
Examples:
A user gets a unexplained error in GP when performing a task. Record the steps taken for the user with Profiler and capture the stored procedure behind the error
Certain posting events are taking much longer than they should to run. Use Profiler to record and analyze the execution time and develop an index that improves the speed and performance for the bottleneck.
Admittedly, this tool is on the technical end of the spectrum when it comes to troubleshooting in GP. To me however it has been very helpful over the years, but only in complicated situations where we needed to review and step through what was going on at the SQL level at a later time.
>> Today in comparison to BC, a lot of that can be seen in Business Central Telemetry, which I describe in the Business Central section below.
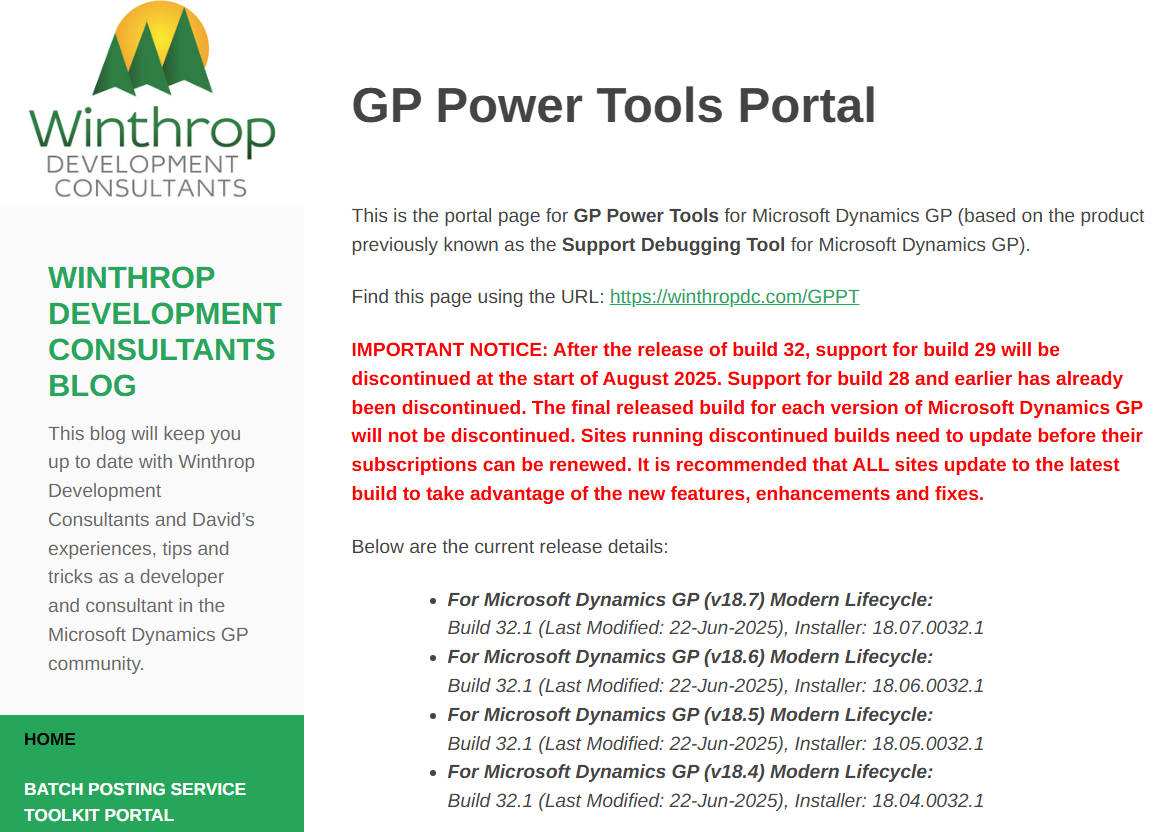
10. Support Debugging Tool (SDT) / GP Power Tools
What it does: Provides advanced diagnostics, logging, and security tracing. And. So. Much. More.
How to use it:
Install GP Power Tools (formerly SDT) - (now a subscription service)
Use features like Resource Information, Security Profiler, and Logging Mode.
Use Deny-Based Security to ensure proper access to resources
Examples:
A user gets a security error. Security Profiler shows which task is missing.
A custom window behaves inconsistently. Logging Mode captures the exact sequence of events.
A third-party product causes a crash. Resource Information identifies the source dictionary.
Learn More:
https://winthropdc.wordpress.com/gp-power-tools-portal/
I highly recommend the products and tools David Musgrave has built into his GP Power Tools product. Truly an act of genius, and he is a remarkable and foundational element of the Dynamics GP community for many decades.
>> You will see from the BC list of troubleshooting tools below there are a wealth of tools available to support monitoring and reporting on ‘the other’ ERP.
Overall…
Troubleshooting in Dynamics GP is all about combining the right tools with a deep understanding of the system’s architecture. Whether you're resolving data issues, fixing security problems, or tracking down performance bottlenecks, these tools will help you get the job done efficiently and accurately. Many of them have a similar counterpart SOMEWHERE in Business Central, and I hope you can see that in the following section on the top tools I have learned about and recommend when troubleshooting or optimizing BC.

BC Tools and Techniques Everyone Should Know About
In this BC troubleshooting overview guide, we’ll explore eleven essential tools and techniques used to track down root causes of performance problems and optimize the cloud-based Business Central environment. These don’t all necessarily compare 1:1 to administering and troubleshooting Dynamics GP, but you will see each tool in your new toolkit has the potential to provide a hint or solve one or more problems. The tools listed below have a few real-world examples to help you master the art of diagnosing and resolving issues, as well as a link to the official BC Learn documentation so you can dive deeper right away.
Note: There are more tools out there than I have reported here, but I’ll update this page periodically as I get comfortable with them and they resolve issues for me! It’s Ok to bookmark this as a reference page!
1. Page Inspection
What it does: Lets you inspect the field data and metadata behind any page.
How to use it:
Open the page in question.
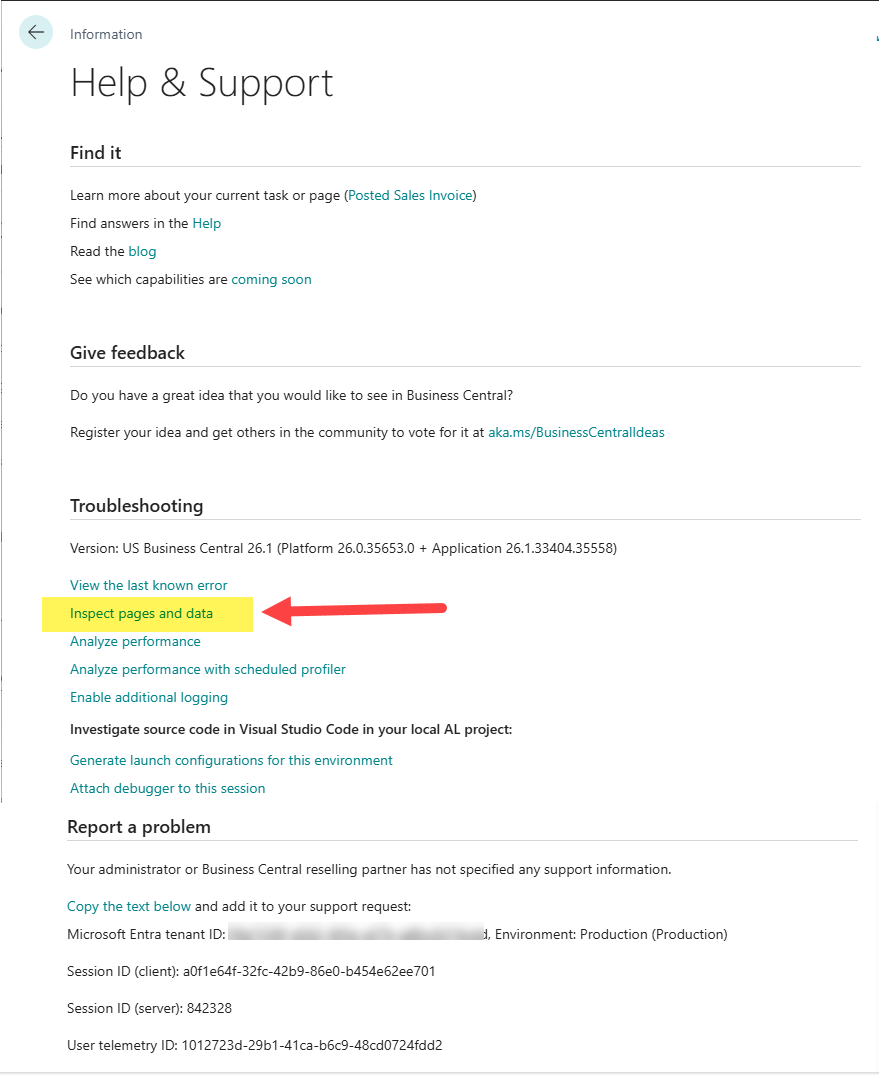
Press Ctrl+Alt+F1 or use the ? icon > Help and Support > Inspect Pages and Data.
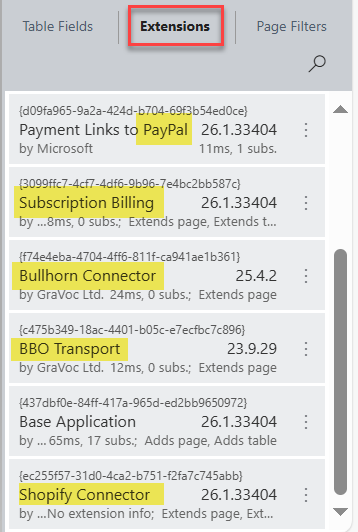
Review the source table, field values, and any extensions affecting the page.
Examples:
A user reports that the “Shipment Date” is blank. Page Inspection reveals a failed custom extension.
A customer’s balance appears incorrect. You discover a misapplied payment on a different customer.
A field is visible for one user but not another. Page Inspection shows the field is part of a personalization or role-specific extension.
Learn More:
https://learn.microsoft.com/en-us/dynamics365/business-central/across-inspect-page
The Page Inspection page is frequently used in troubleshooting to reveal or confirm fields or values in a record. It shows the table ID and name, the field name, type and length. It also can highlight any extensions on the page that may be interfering and causing trouble.
You can see when navigating in that the Troubleshooting menu actually offers MORE than one option! I’ll review the other tools listed here and their purposes later in this article. You want to know about those too.


2. Change Log Entries
What it does: Tracks who changed what, and when.
How to use it:
Set up Change Log.
Go to Change Log Entries.
Filter by table, user, or date.
Review field-level changes with timestamps and user IDs.
Examples:
A customer’s payment terms were changed unexpectedly. The log shows a bulk update by a finance user.
A vendor’s bank account was altered. The log identifies the user and timestamp.
A GL account was renamed, breaking a report. The log shows it was changed during a chart of accounts cleanup.
Learn More:
https://learn.microsoft.com/en-us/dynamics365/business-central/across-log-changes
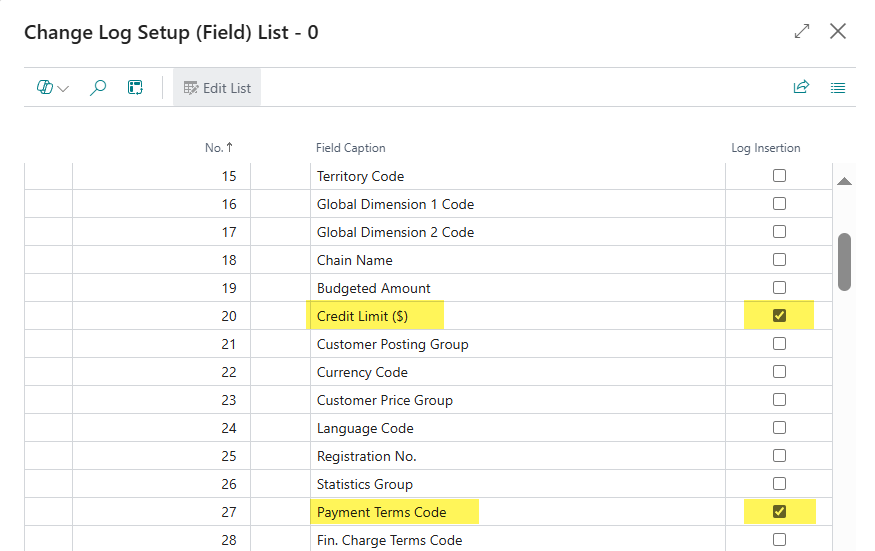
The Change Log needs to be configured so it knows what changes to track on which tables, and then it needs to be Activated to begin recording changes. As you will see below, the setup process is straightforward, and highly recommended for easily tracking and reporting on changes in the tables and/or fields of interest.
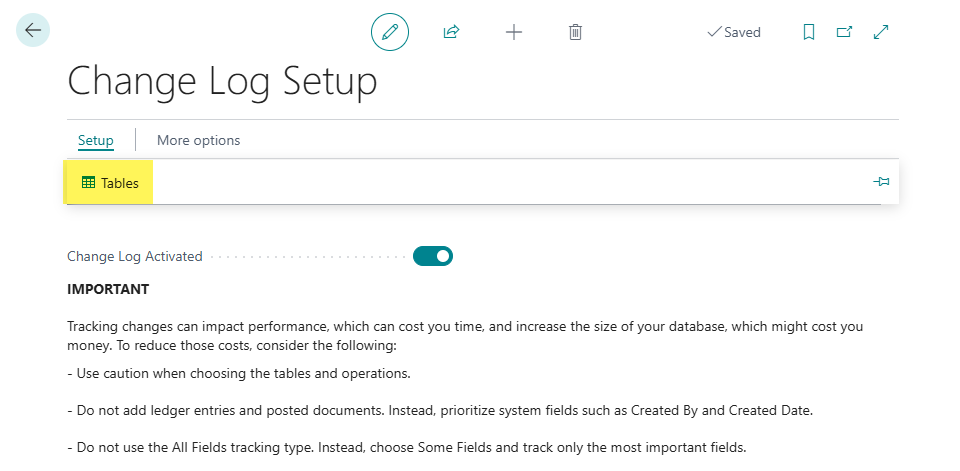
Select which tables you want to enable the Change Log for.
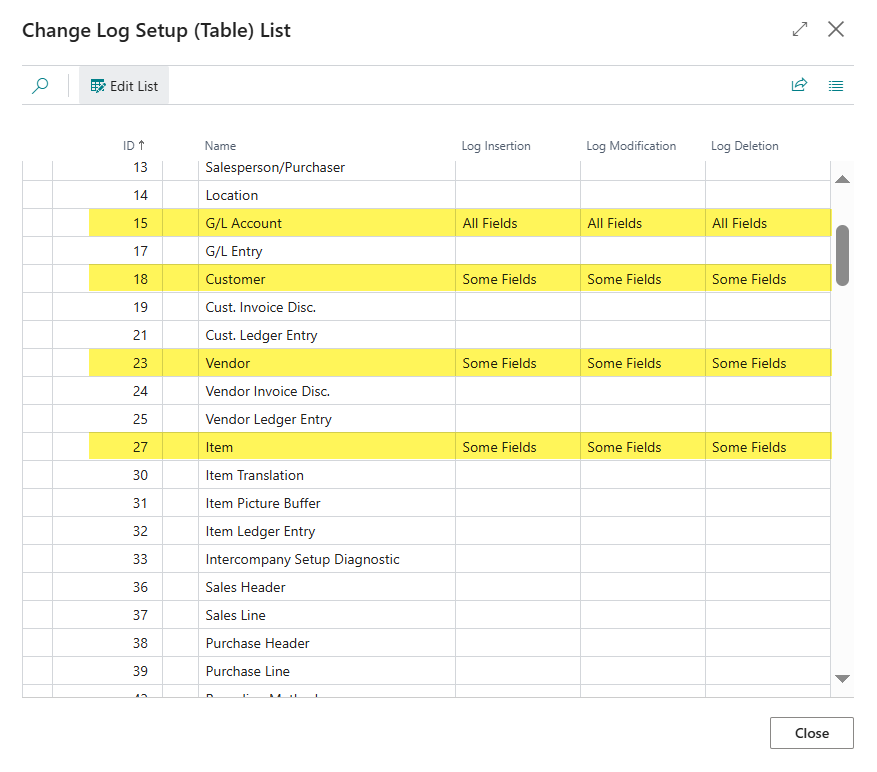
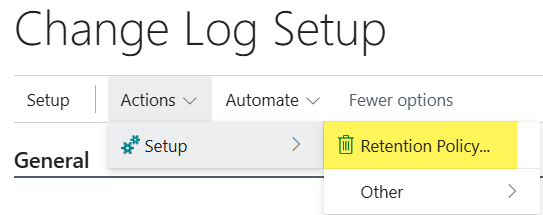
Select which fields to detect changes on for optimal performance, otherwise All Fields is an option for configuration. Just be aware of what table you are setting this up on, and consider a Retention Policy that trims the excess from the log table.

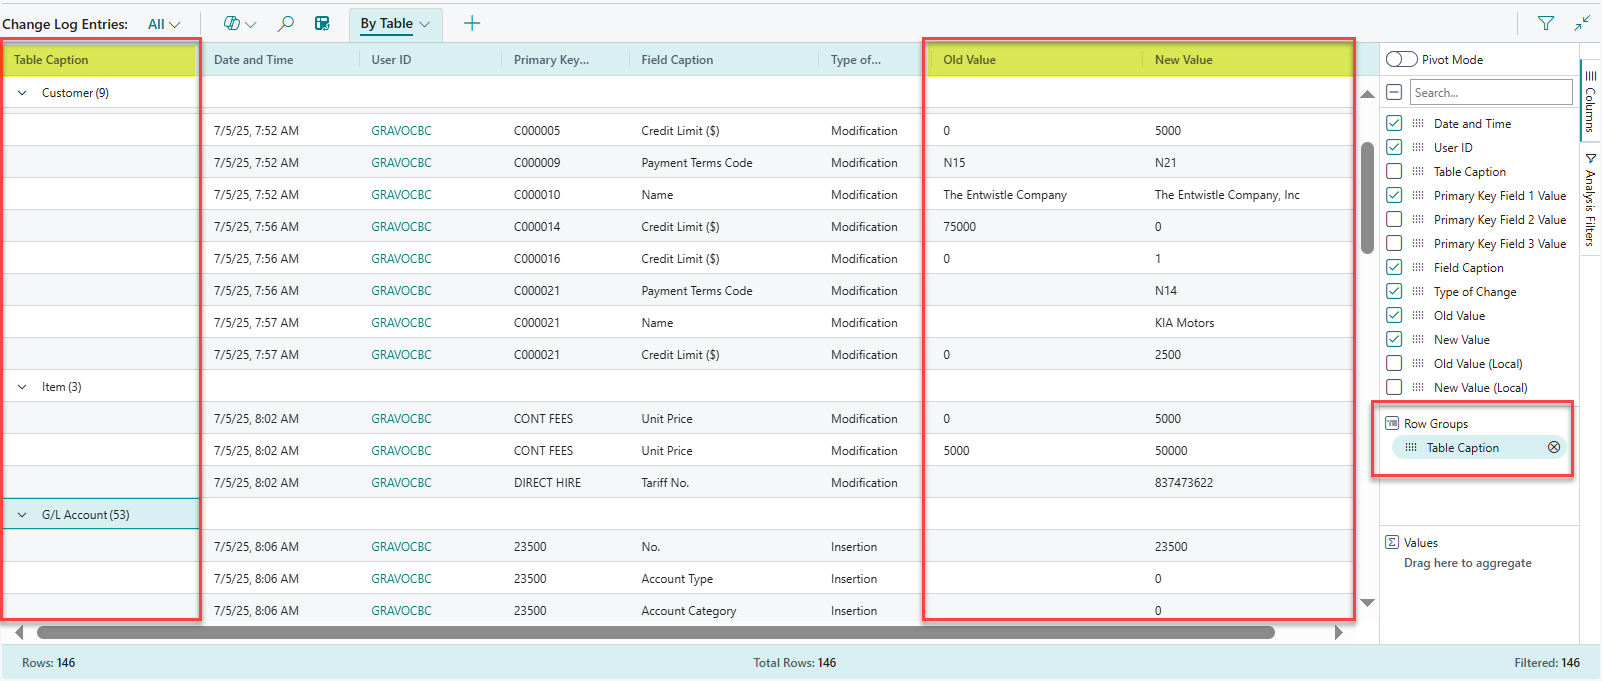
Over time the log will fill with changes. I like to use Analysis Mode to view the log, and then I group either by User, by Primary Key, or by Table as you can see below.
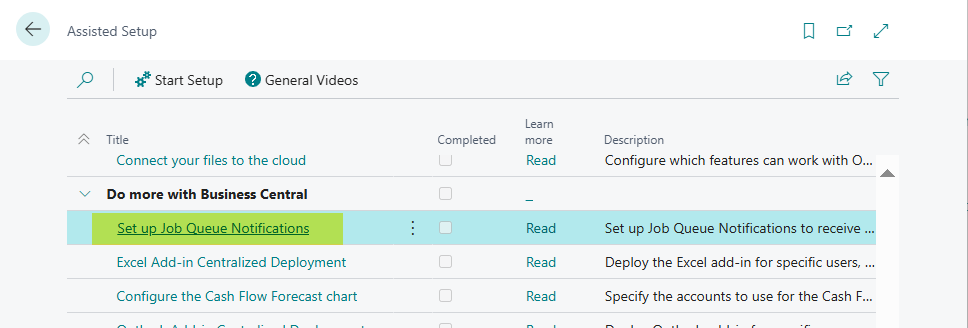
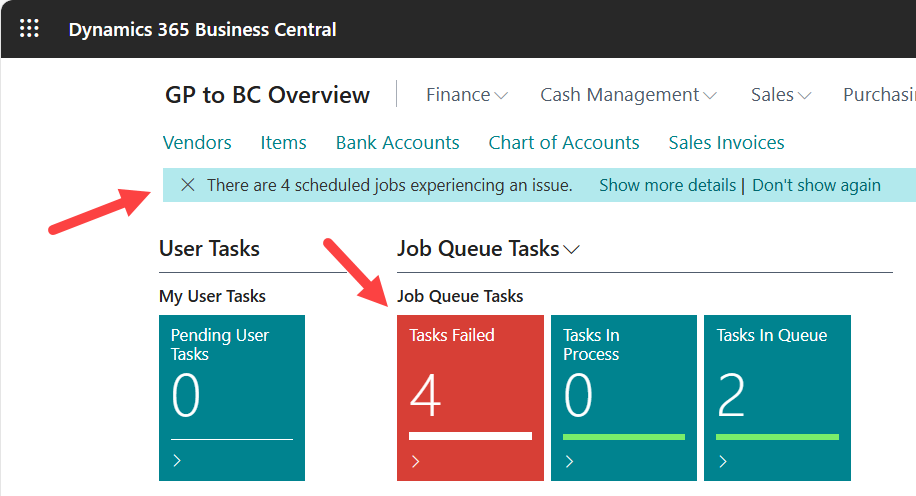
3. Job Queue Log Entries and Error Notifications
What it does: Logs background processes and their outcomes.
How to use it:
Go to Job Queue Entries.
Select a job and view Job Queue Log Entries.
Look for failed runs and error messages.
Examples:
A nightly email job fails due to SMTP authentication issues.
A currency update job fails because the web service URL changed.
A recurring inventory sync job fails due to a locked record in the Item table.
Learn More:
https://learn.microsoft.com/en-us/dynamics365/business-central/dev-itpro/developer/devenv-job-queue
A lot of events in BC are tied to a Job Queue Entry, and when they fail or encounter issues, they make an entry to the Job Queue Log Entries table. This page can be filtered down to uncover potential root causes of related failures reported (or not!) by users.
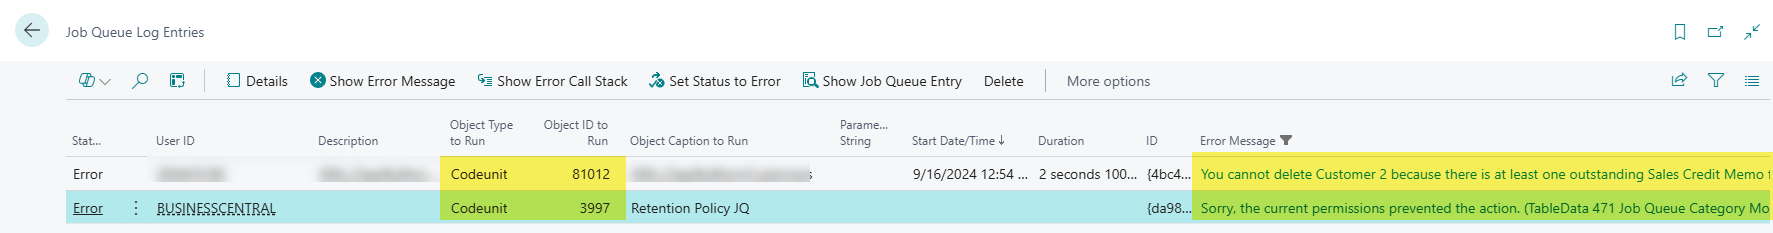
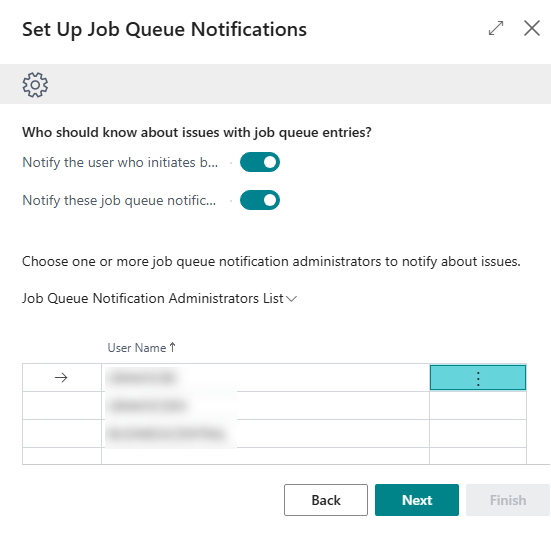
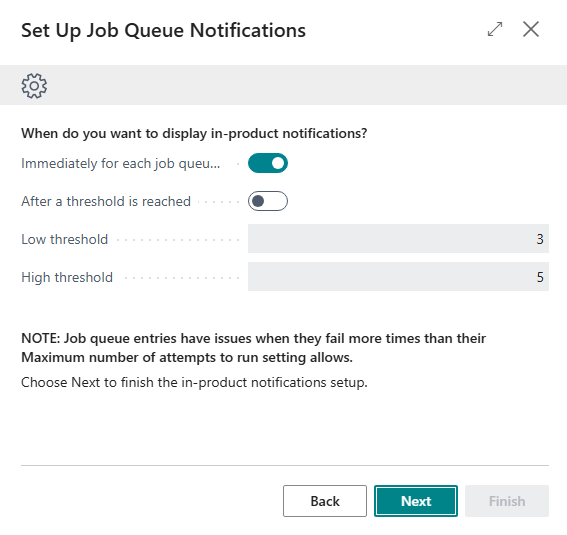
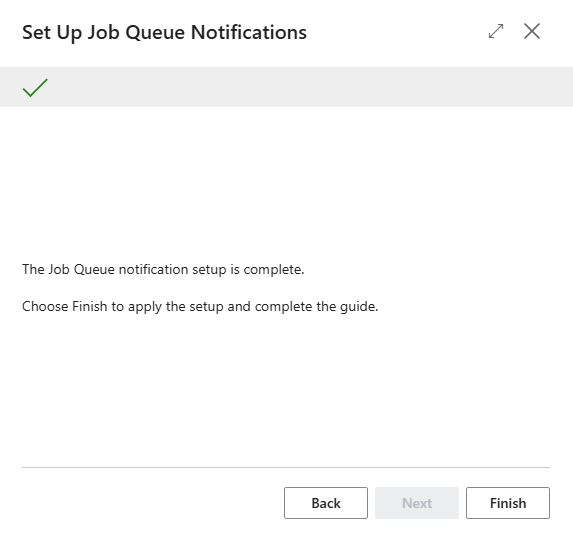
In-App Notifications can also be enabled for failed Job Queue Entries, which proactively sends an alert that something has failed, rather than find out late.
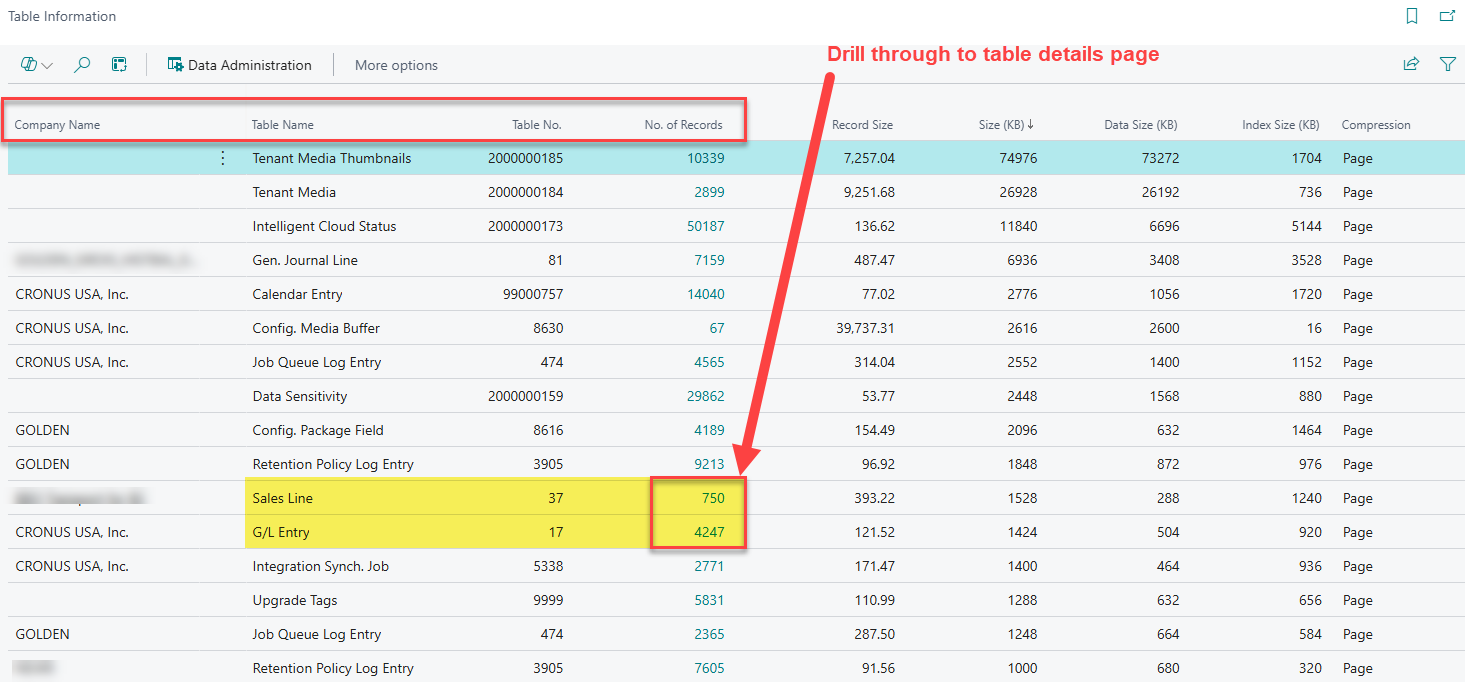
4. Table Information
What it does: Shows record count and size for each table.
How to use it:
Search for Table Information.
Sort by size or record count.
Identify large or bloated tables for cleanup.
Examples:
The Change Log Entry table has millions of records, slowing performance.
The Sales Invoice Header table is bloated with test data.
The Email Outbox table is full of failed messages from a misconfigured SMTP setup.
Learn More:
https://learn.microsoft.com/en-us/dynamics365/business-central/admin-view-table-information
The Table Information page is perhaps the worst-performing page in all of BC. It can take a long time to open, so if you want to use it, do it in a separate browser tab. It is really helpful though, because you can see a lot about database usage and table statistics. Apply filters, and re-sort columns as needed, but you need to wait while the page repropagates after each iteration.
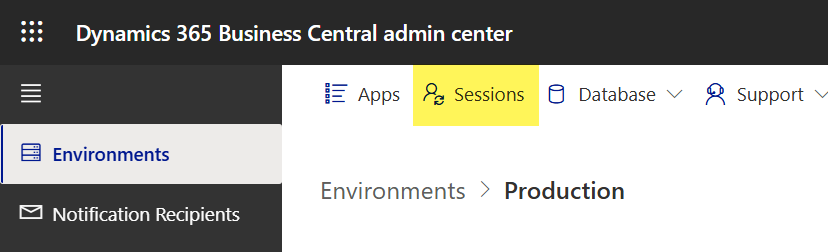
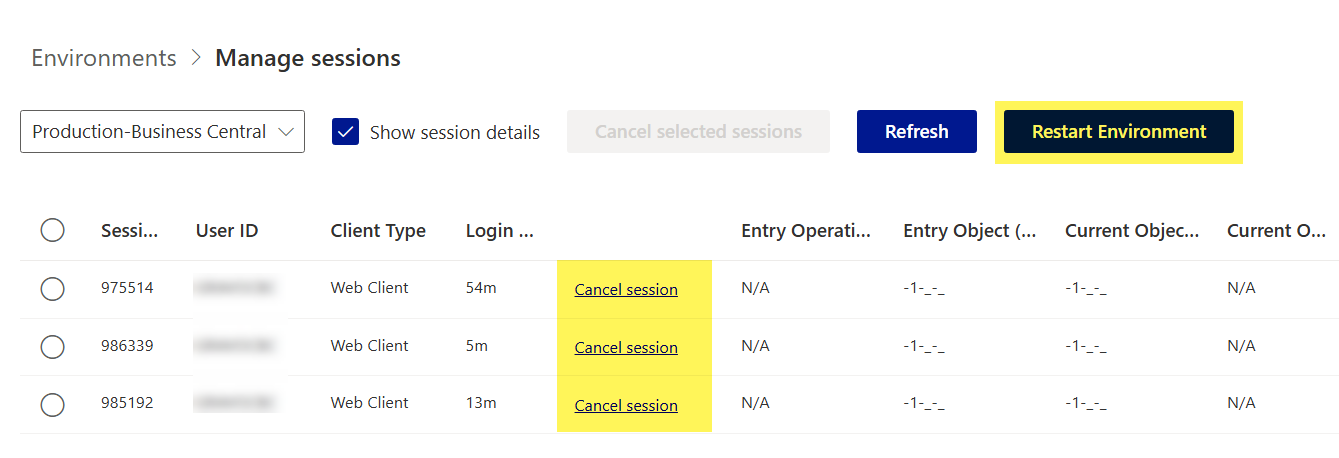
5. Active Session List, Restart Environment (Admin Center tasks)
What it does: Displays active user sessions for each environment, and the place where you can reboot the entire environment when needed.
How to use it:
Go to Admin Center.
Review session duration, user ID, and client type.
Terminate sessions if necessary.
Restart the BC environment if needed.
Examples:
A user locks a sales order for over an hour, blocking others.
A background session runs a report every 5 minutes, consuming resources.
A user session is stuck in a loop due to a browser issue—terminating it resolves the problem.
Learn More:
Only BC Admins can access the active Sessions list for an environment, because it is only accessible from the BC Admin Center, limiting those who can quickly and easily tell who is ‘in the system’ at any given time. This seems silly to me - why can we not also see the list of active users from a page in the app as well? Perhaps I am just missing a window somewhere but I have looked long and hard for one! In current form however, the Admin Center window also allows for termination of long-running or stranded sessions, and the ‘reboot’ of the environment.
6. Telemetry & Application Insights
What it does: Provides real-time telemetry for performance and errors.
How to use it:
Set up Application Insights in Azure, then deploy and connect PowerBI Telemetry App, and enable telemetry on each environment.
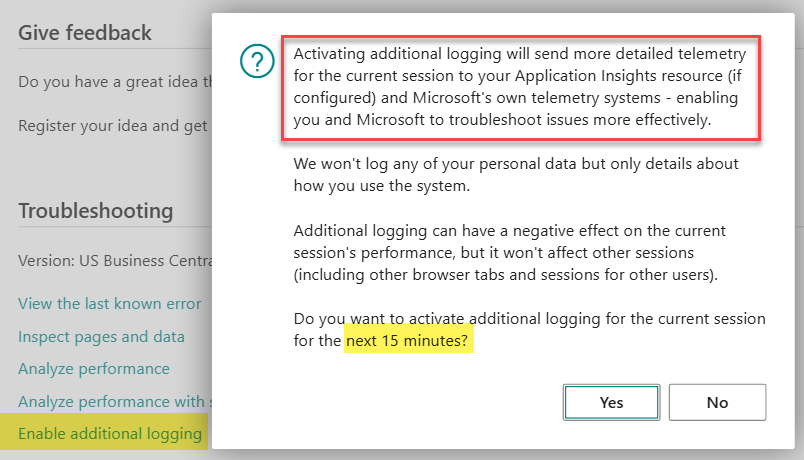
Encourage users to capture additional telemetry from the help page (Press Ctrl+Alt+F1 or use the ? icon > Help and Support > Enable Additional Logging
Analyze Power BI App Reports
Advanced: Use Kusto Query Language (KQL) to analyze logs and metrics.
Examples:
Posting purchase invoices crashes intermittently—telemetry shows it’s tied to a vendor with missing posting groups.
A Power Automate flow fails due to API throttling.
Users report slowness at 9 AM daily—telemetry shows a large report runs at that time, consuming resources.
Learn More:
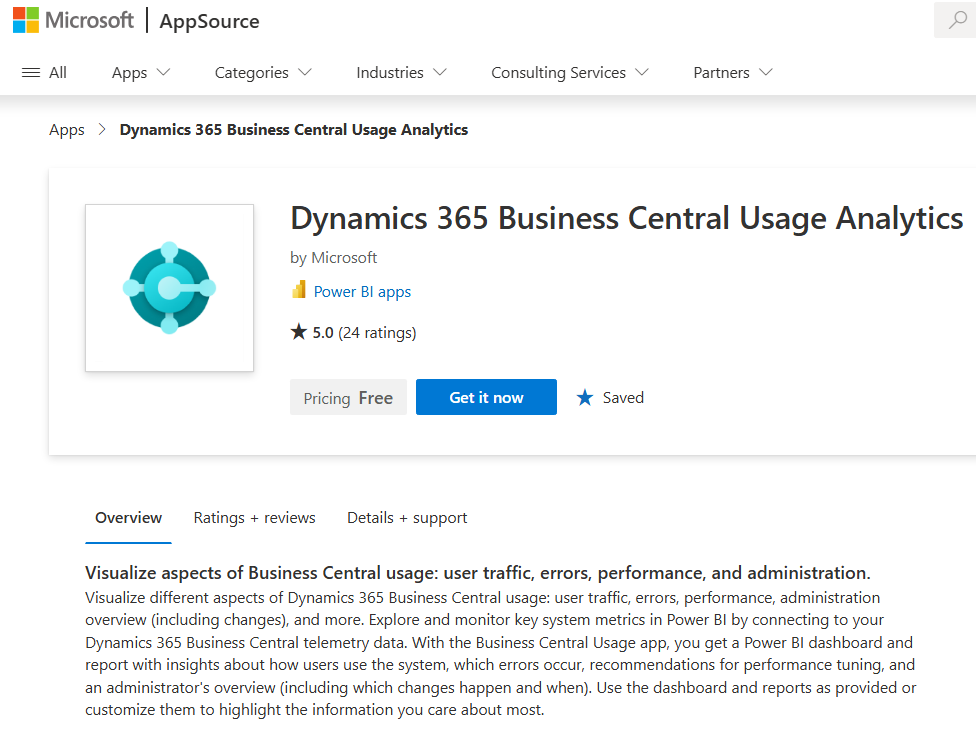
One of my favorite troubleshooting tools for Business Central is the Power BI Usage App that reads the Usage and Telemetry data emitted by BC directly from Azure Application Insights. The dashboard app is available from AppSource, it is easy to install, and collects an absolute wealth of information that assists with supporting an optimal and performant BC environment. And it automatically refreshes once a day, but you can dial that up more if needed.
For those who really want to geek out on the Telemetry data, many of the dashboard pages have the KQL code at the very bottom to use as a base for querying deeper with Azure Data Explorer or related tools.

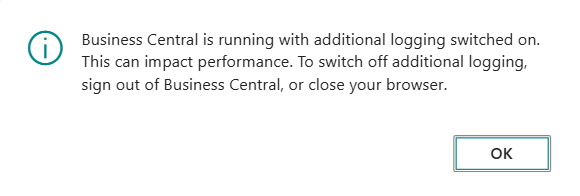
One nice feature is that a user can help with troubleshooting sometimes by going back to the Help page and click the ‘Enable Additional Logging’ link so that additional telemetry for that user and session is emitted and made available for review and analysis. If they can recreate the issue in BC within the next 15 minutes, that could help pinpoint root causes.
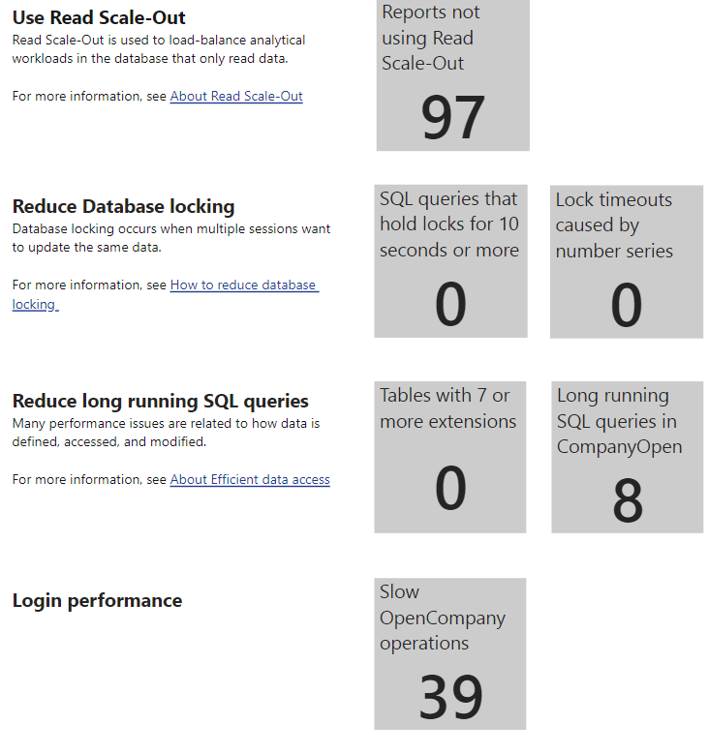
This is a high-level snapshot of the four Power BI App Dashboard menus, with 20 of my go-to favorites listed when I review information in Business Central. I present at conferences on these dashboards often and enjoy all the feedback I get from those who go forward and get this hooked up! These reports are really helpful and you can spend hours and hours just combing through the information.

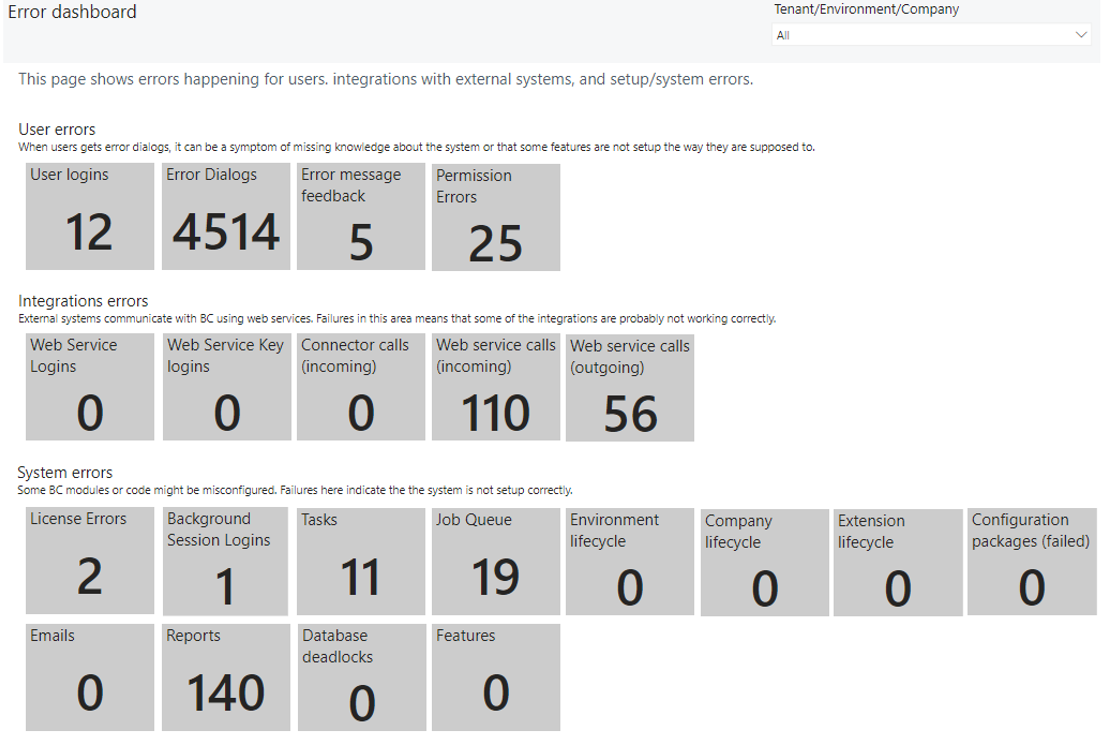
In one example, the Error Dashboard is useful for a high-level overview of potential problems going on in the system. Some tiles have drill-through capability into a detailed page for further investigation.
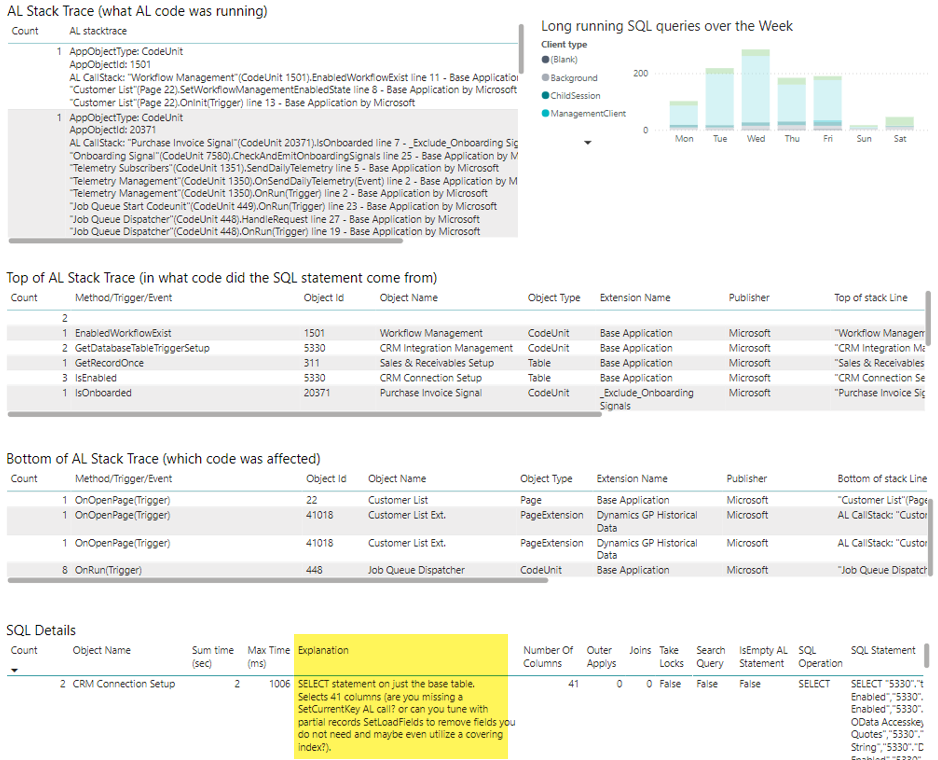
The Performance Dashboard is useful if you want to dig into some details about SQL or other recent database performance highlights.
In this technical example, we are investigating log-running queries. Interesting that the analysis offers some suggestions that might help improve performance for a specific SQL statement.
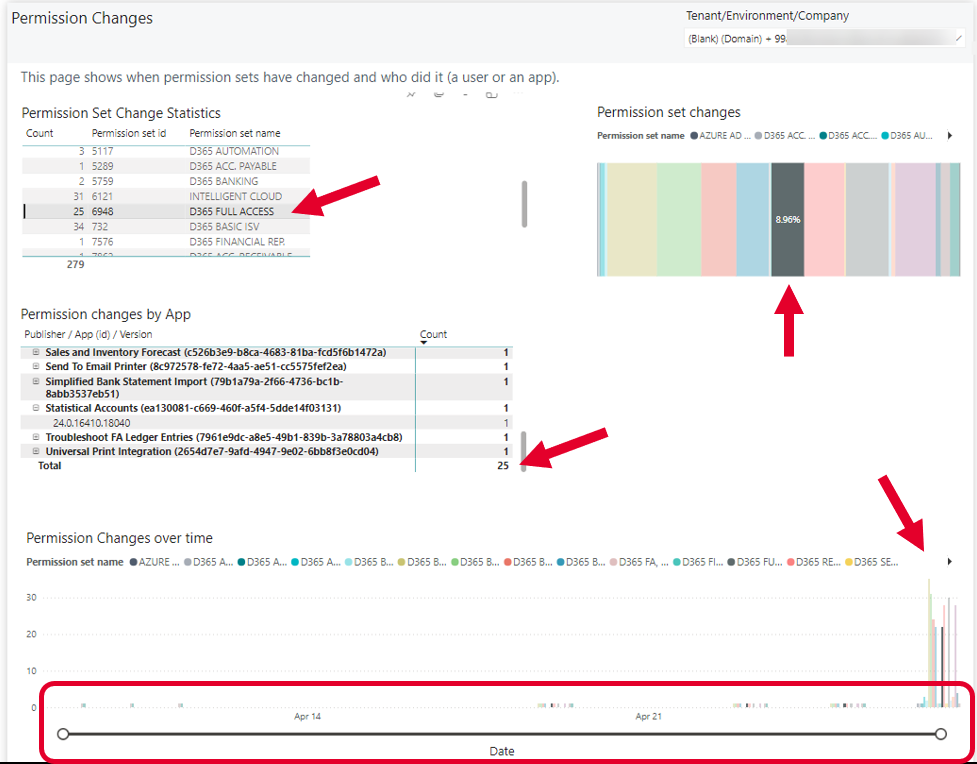
One of the pages I pay close attention to is the Permissions dashboard because it details changes in Permission Sets, and when they are pushed into BC with a scheduled or automatic update, in either the Production or Sandbox environments.
7. Effective Permissions, Permission Set by User
What it does: Shows what a user can actually do in the system.
How to use it:
Go to Users > Effective Permissions.
Review table-level access and permission sets.
Examples:
A warehouse user can’t post shipments—missing Modify permission on Warehouse Shipment Line.
A finance user can’t run a report—missing Execute permission on the report object.
A user can’t access a custom page—Effective Permissions shows the page is restricted by a role center.
Learn More:
A lot of times errors the user is experiencing can be related to a permissions issue. These can be easier to diagnose and fix with the Effective Permissions page. Select a User and Company, and then the page filters down to all of the objects and permissions they currently have assigned, with their Permissions Sets listed at the bottom as well. Ideally you can identify a missing Permission Set, or one that needs to be created or adjusted to close the permission gap.

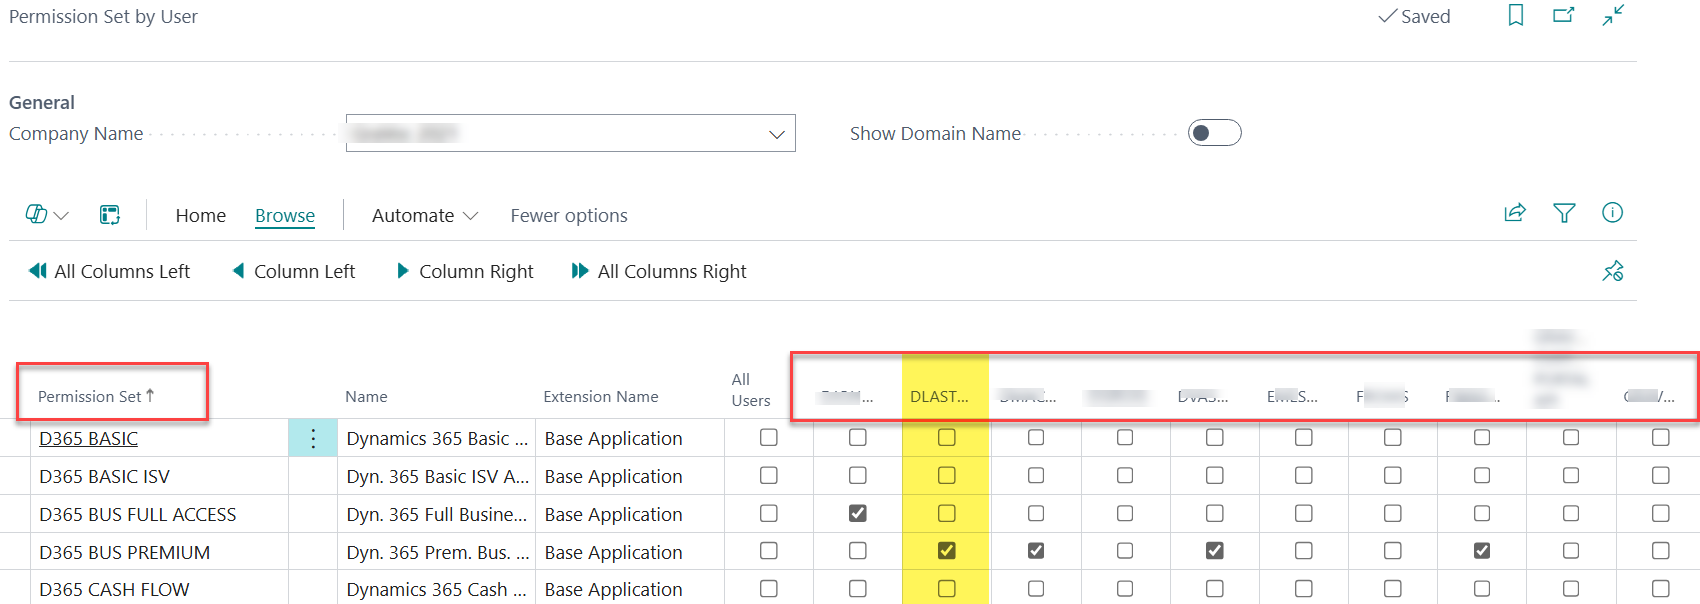
While investigating security or access issues across Multiple Users and Permission Sets, consider the Permission Set by User page for more of a bird’s eye and comparative view. It displays all of the users and all of the permission sets, and all of the sets assigned to the users.
8. In-client Performance Profiler
What it does: Captures performance metrics directly within the Business Central client, showing where time is spent during user interactions.
How to use it:
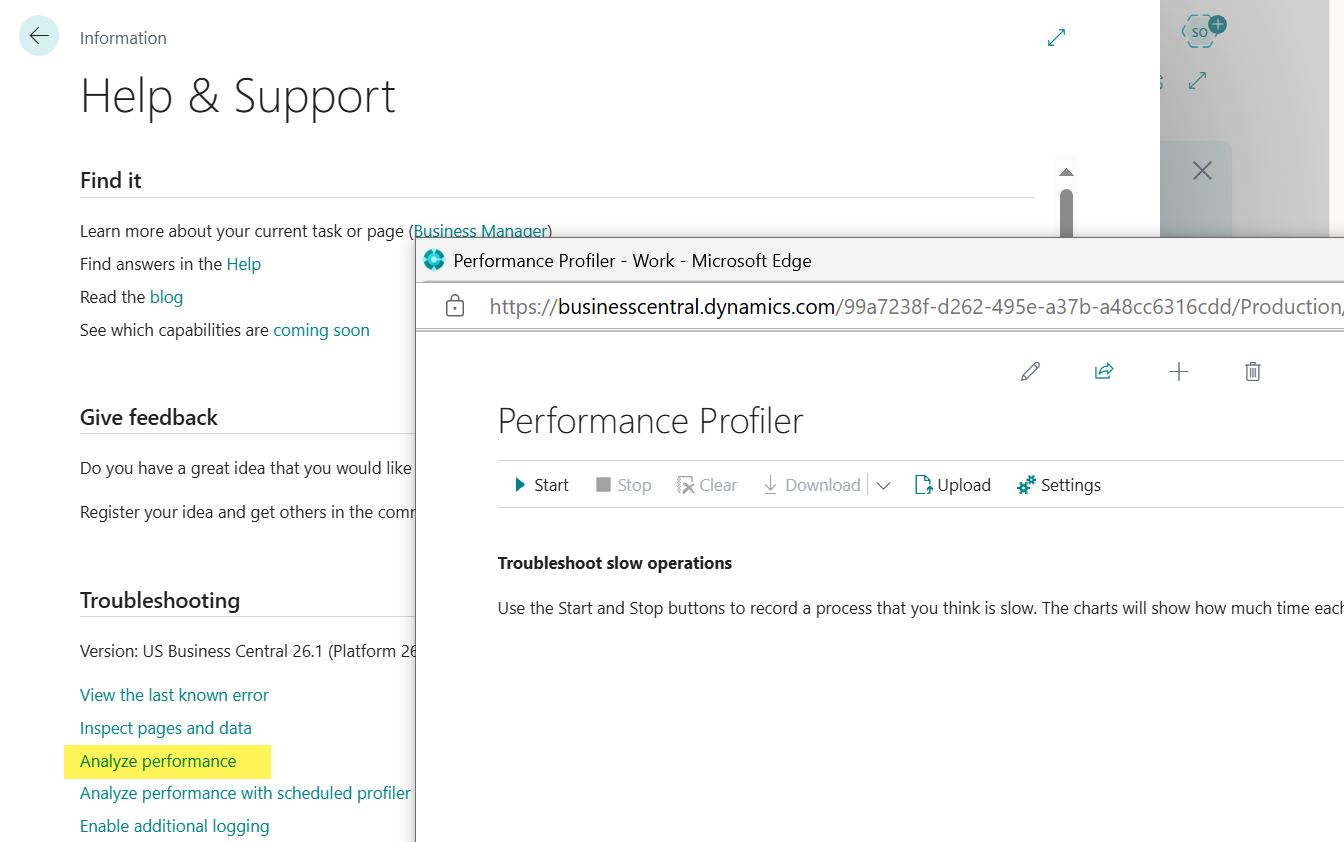
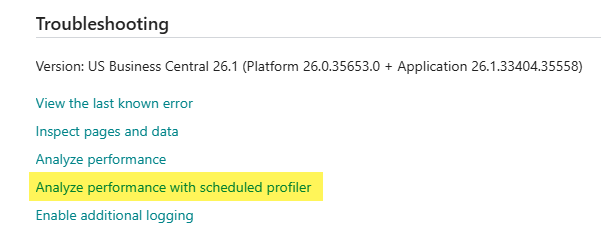
Go to the Help & Support page and select Analyze Performance to open the Performance Profiler and click Start.
Perform the action you want to analyze (e.g., open a page, run a report, post a document).
Stop the profiler and review the detailed breakdown of execution time by AL methods, extensions, and system calls.
Examples:
A sales order page takes several seconds to load. The profiler shows a custom extension is adding delay during page rendering.
Posting a purchase invoice is slow. The profiler reveals that a long-running event subscriber is executing during posting.
A user reports lag when switching between tabs. The profiler identifies a slow-running factbox extension.
Learn More:
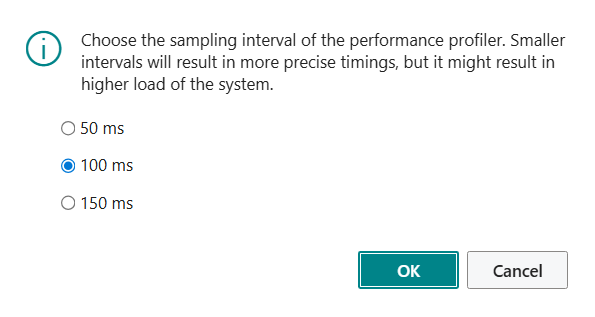
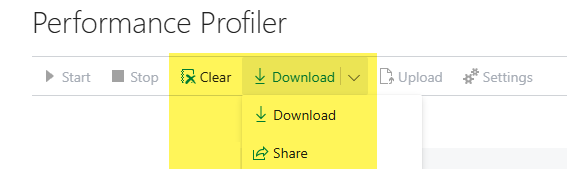
Optimal performance is important for a positive end user experience. When things feel sluggish, or as part of a development effort, the user can pop into the Performance Profiler and record their session for a while. When done, Stop the session and save it, and if needed, can be downloaded and shared with others for analysis. If the sample taken was not very good or of no further use, use Clear to start a fresh one without saving the prior one. The tool works on a sampling method, (as opposed to streaming) and you can choose which intervals to perform sampling of the tasks for the recording.
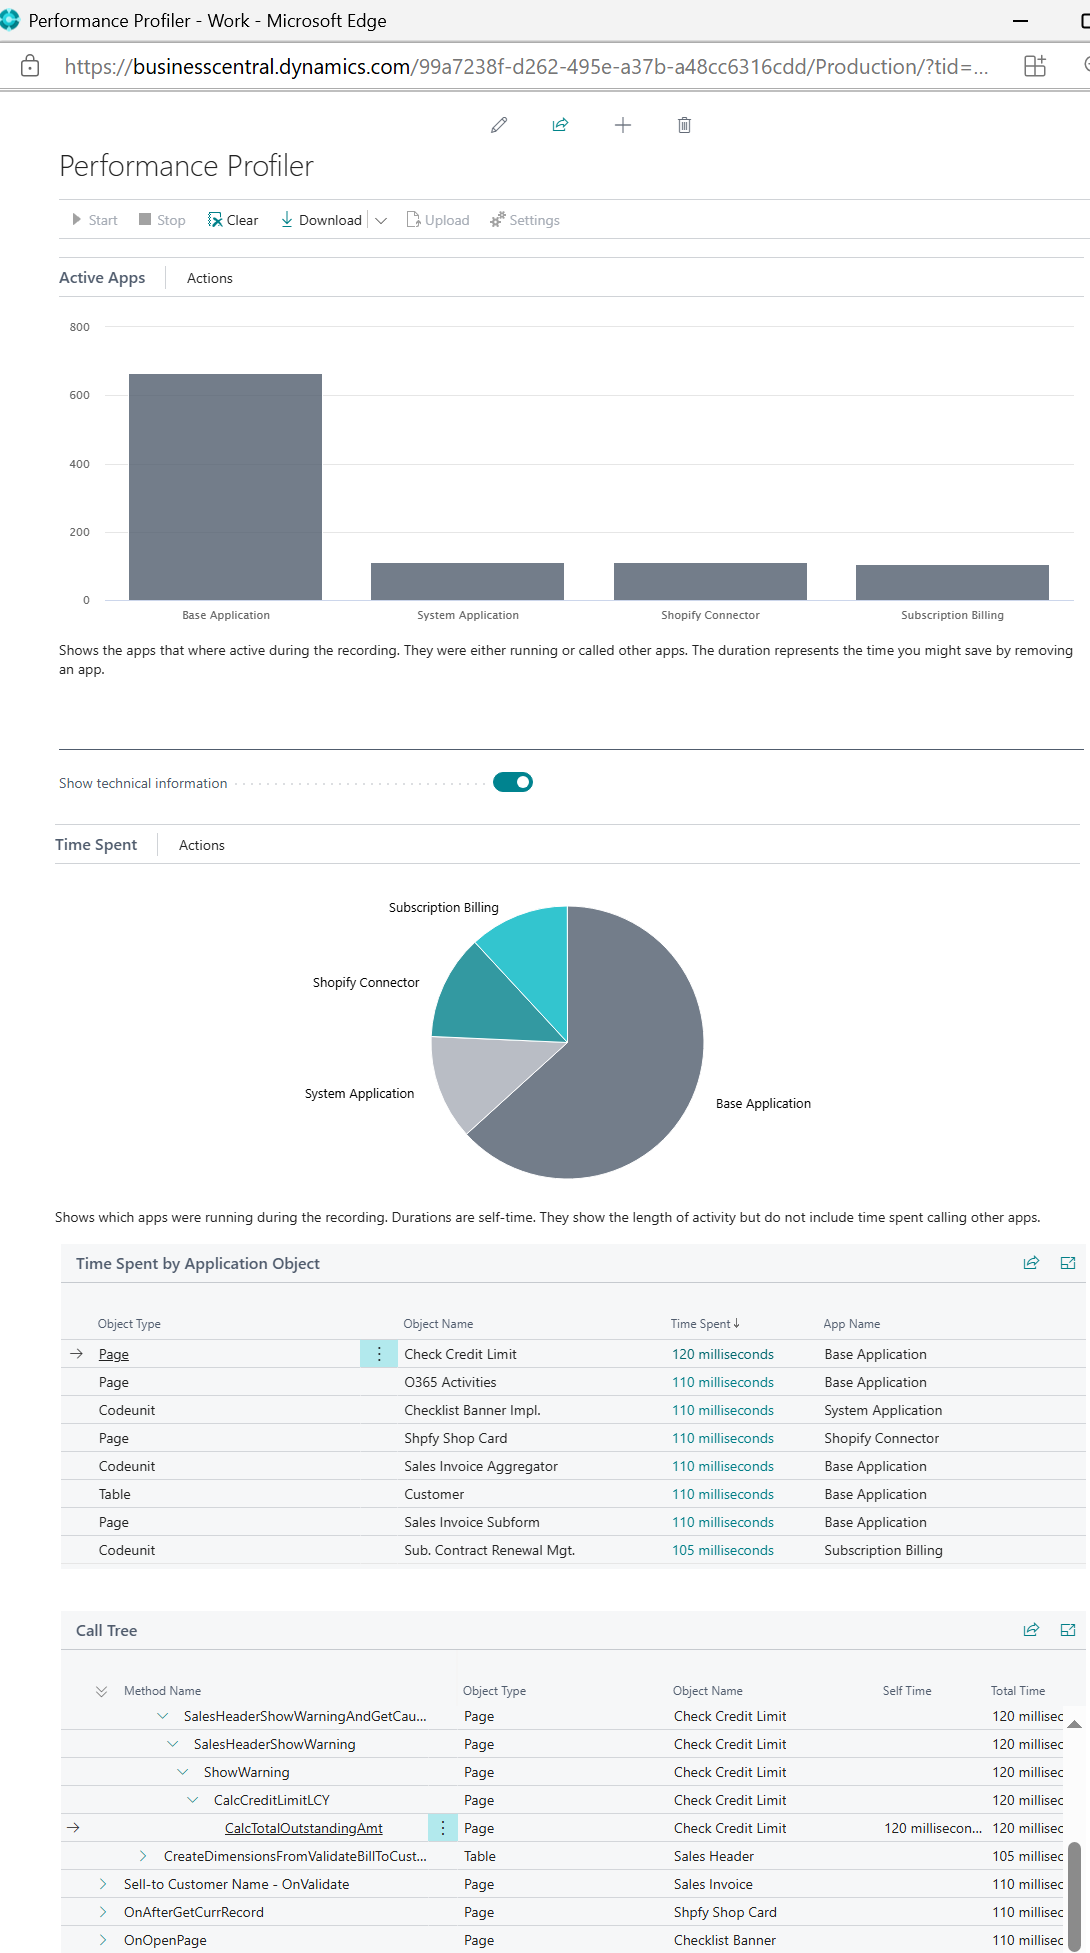
After finishing the performance recording, the page performs some level of analytics on the session and dishes up additional details about objects and usage statistics.
Download the results and send to someone who can help interpret!
9. Profile Scheduler
What it does: Automates the collection of performance profiles on a schedule or based on specific triggers.
How to use it:
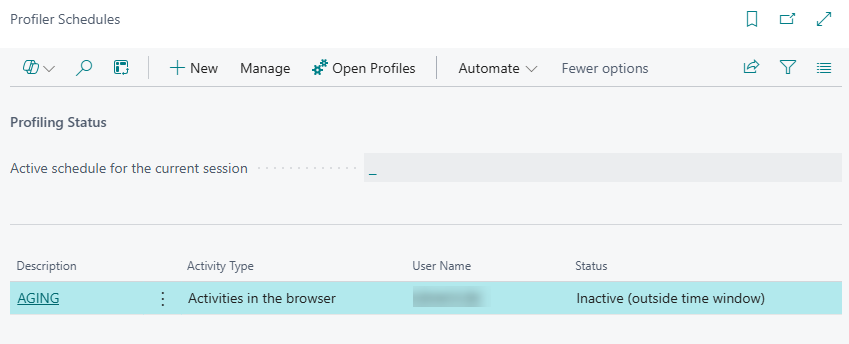
Search for Profile Schedules in the Tell Me bar.
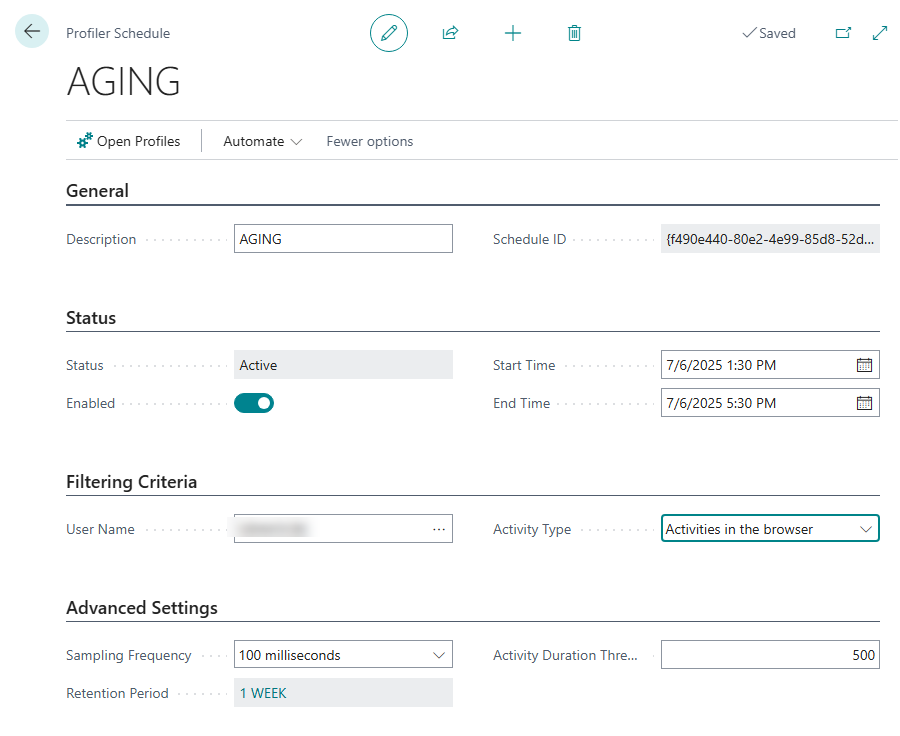
Create a new profile schedule, define the target user or session, and set the trigger (e.g., on login, on page open).
Review the collected profiles in the Performance Profiler page.
Examples:
You want to monitor performance for a specific user group during peak hours. The scheduler collects profiles automatically at login.
A recurring slowness issue happens only on Mondays. You schedule a profile to run every Monday morning for affected users.
You’re testing a new extension in a sandbox. The scheduler captures performance data every time a test user opens the Sales Order page.
Learn More:
Sometimes it makes more sense to set up a scheduled recording to run for a user over a set period of time rather than just run the Profiler on the fly. Using a Profiler Schedule can aid in setting up automation for troubleshooting or recording performance over a period of time when multiple complex processing events might be going on and you want to witness the impact on a specific user’s experience.
10. AL Profiler
What it does: Provides a developer-focused view of AL code execution, including method calls, durations, and extension interactions.
How to use it:
Open Visual Studio Code with your AL project.
Use the AL Profiler pane to connect to a sandbox session.
Start profiling, perform the action in BC, and stop profiling to analyze the trace.
Examples:
A custom report takes too long to generate. AL Profiler shows inefficient looping in the report’s data item triggers.
A new extension causes unexpected behavior. AL Profiler reveals that a subscriber is overriding standard logic.
You’re optimizing a custom API. AL Profiler shows which procedures are consuming the most time during the call.
Learn More:
I am still working with this troubleshooting tool, but check back periodically for updates and relevant graphics soon. In the meantime, follow the link above if you are feeling adventurous and want to dig deeper into this technical solution!
11. Snapshot Debugging
What it does: Captures a step-by-step trace of code execution.
How to use it:
Enable Snapshot Debugging in a sandbox via Visual Studio Code.
Reproduce the issue.
Analyze the snapshot to trace the AL code execution.
Examples:
A posting routine fails due to a division by zero error.
A custom workflow fails to send notifications due to a logic gap.
A custom API endpoint returns incorrect data. Snapshot Debugging reveals a misused filter in the AL code.
Learn More:
I am still working with this troubleshooting tool, but check back periodically for updates and relevant graphics soon. In the meantime, follow the link above if you are feeling adventurous and want to dig deeper into this technical solution!
Overall…
The intent of this post is to share a number of important tools the “non-developer” can latch on to to help optimize and support the BC environment. There are many other technical tools available for troubleshooting, regression testing, and performance testing in Business Central than I have written up here. And even the ones I did highlight were primarily technical in nature.
Regardless, I hope you can see the benefit of knowing you have at least these 11 tools to lean on, depending on the situation you are faced with. I hope they give you the visibility and control you need to get at the root of and resolve issues quickly and confidently—whether you're supporting finance, operations, or IT.
I’m grateful should this experience or these insights be helpful to you on your journey…until next post!